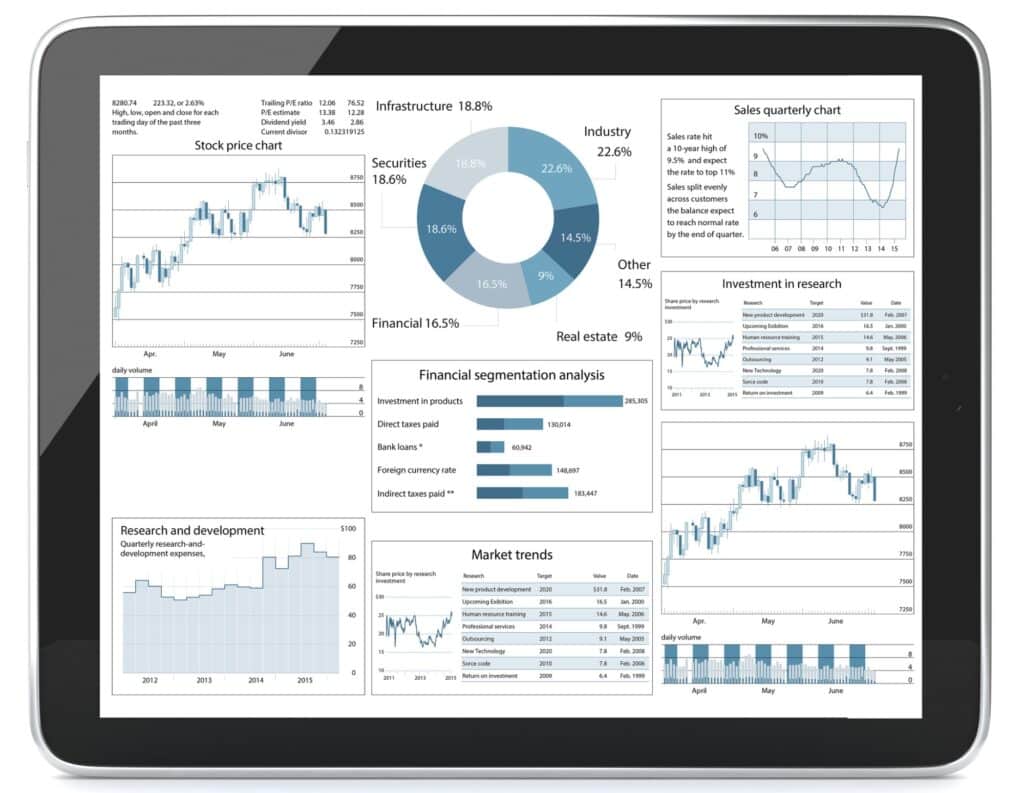
Making a business decision without data to back it up is a recipe for disaster. Form strategic decisions with solid evidence by using a business intelligence tool. Combine data sets from across your entire organization and use visualizations to dig deeper into your business analysis.

What Is Business Intelligence?
A Business Intelligence (BI) tool is software that gathers, stores, analyzes, and provides access to data. Having one place to gather all your business data points and analyze them is the best way to make sure you are staying on top of your entire organization. Use BI for a variety of tasks:
- Data Visualization
- Data Mining
- Predictive Analytics
- Customer Analytics
- Forecasting
- Reporting Dashboards
- Monitor Trends
- Track Performance
Business Intelligence is able to complete these tasks by loading data from various sources and allowing you to interact with the data in whatever way you may need. Users can create dashboards specific to projects or departments. Giving management a way to show their sales team or marketers how their efforts are performing. There are many more reasons why a BI tool is of great use to your organization.
Why You Need One
While you may believe that your current reports from individual applications are giving you accurate data, that might not be the case. It’s really difficult to analyze an entire organization when data from the CRM, Finance Suite and Email Manager are all separated. Using a Business Intelligence tool, you can sync all of your data points across those applications into one system. This will allow you to directly compare and analyze what effect different aspects of your business are having on one another. It’s much easier to spot a pattern in your sales practices when all your data is one visualization.
Example
An owner of a few retail chain stores wants to analyze the sales metrics across her stores. In order to do so, she gathers all of her data sources into BI. Here she can see the sales data, customer demographics, inventory, and market pricing for each location. Then using different reports, she can create a dashboard with various data visualizations to compare the retail stores. By combining these data sources, she will gain deeper insights into the overall sales and how to better optimize the retail operations.
The data collected within your BI tool will help you make more informed business decisions. But it’s not just for upper management and data analysts. Your sales team will appreciate being able to view their stats and give middle managers an accurate view of their overall performance. The entire team can benefit from the BI tool.

Best Practices
Jumping right into using a BI tool can be overwhelming. There are a lot of customizations and strategies to use. It’s important to start out in the right direction so the chase of misinterpreting data is minimized. We’ve wrapped up some best practices to help you get started with the BI tool of your choosing.
- Start small and add on gradually. Choose a few KPIs (key performance indicators) to focus on, then slowly expand your view. Going into using a BI tool, most likely you have a few important metrics in mind. Once you have those down, continue with your reporting and analyzing to maximize your BI tool as you become more comfortable using it.
- Prioritize the accuracy of the data. When you start to integrate different applications or import spreadsheets into the BI tool, it’s crucial that you don’t duplicate the data. Make it a priority to upload accurate data into the system so that your reports are as accurate as possible.
- Take advantage of customization options. There are tons of ways to customize data visualizations, dashboards, and other reports. Take the time to make the most out of those customization options in order to meet the needs of your organization’s specific requirements.
- Configure permissions early on. While it’s tempting to allow all users access to create reports and dashboards, it may cause issues. Establishing permissions for users will give your organization peace of mind that not just anyone can edit the most important metrics that are being used to make strategic business decisions.
- Regularly review reports and trends. As your data points continue to sync into the BI system, your data will continue to change. Remember to check in regularly to review what has changed. Keeping up with the relevant information will prepare you to make informed decisions.
Options
There are lots of options for business intelligence tools. Some are more complex than others. It’s important to choose a BI tool that fits your specific needs. Here are some of the top BI tools on the market:
Zoho Analytics & Zoho DataPrep
If you are a Zoho user, you are most likely taking advantage of their BI tools. Zoho Analytics and Zoho DataPrep are both top-rated products that aid in connecting, transforming, reporting, and analyzing data.
Zoho DataPrep is a unique application that cleans up your data before inputting it into another platform like a CRM or Analytics tool. With accurate data being so important in making business decisions, DataPrep gives you that reassurance that your data is true.
Zoho Analytics has a lot of customization and third-party integrations, making it easy to analyze data across your entire organization. Create stunning dashboards and run automations to produce reporting on your schedule.
Microsoft Power BI
Power BI is known for its ease of use and is a top pick for a lot of Microsoft Office Suite users as they are already familiar with the interface. The capability to analyze data and create beautiful visualizations from multiple data sources ranks it as a top BI tool. However, Power BI has been known to have issues with bulk data analysis.
Tableau
While Tableau is on the more expensive side, it is one of the top choices for more seasoned data analysts. Quickly import large data sets and analyze them easily with a large variety of in-depth visualizations. Once familiar with Tableau it is a strong BI tool for complex data analysis.
More On Zoho Analytics & Zoho DataPrep
Learn more about our favorite BI tools by visiting the Zoho Analytics resource page and the Zoho DataPrep resource page. You will find video tutorials, articles, guides, and more details on these great products.


