Zoho PageSense is an analytics tool that helps you produce the best possible website. By running what PageSense calls “experiments,” you can test different configurations of your web pages to determine which one produces the best metrics. With A/B testing, split URL testing, funnel analysis, and more, Zoho PageSense is an essential tool for optimizing your web traffic and increasing web conversions.
Installing the PageSense Code Snippet
To run PageSense, you must have a snippet of code installed on your website. Just like with Google Analytics, insert the PageSense code snippet into the HTML code of your website, specifically in <head>. If you have direct access to your site’s HTML insert the snippet into the correct place by following the steps below.
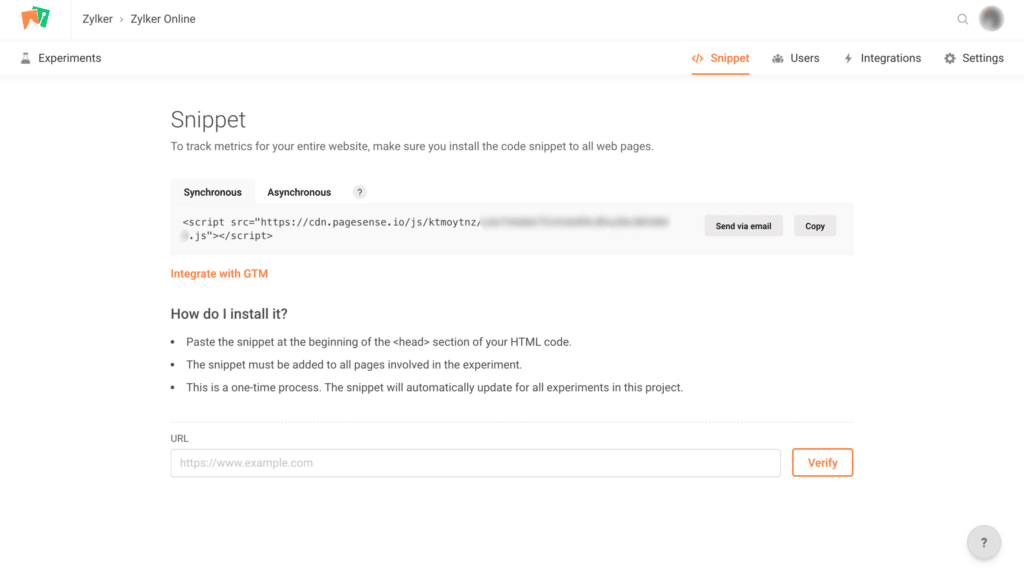
Installing Your PageSense Code Snippet
- Go to the Snippet page by clicking the Snippet icon in the top pane.
- Copy the code snippet shown.
- Paste the code snippet into the page of your website on which you wish to run experiments. Paste the snippet at the start of the <head> tag of the web page’s HTML code.
You can verify that you installed the code snippet correctly by entering the experiment page’s URL into the Verify Your URL section of the Snippet page.
This code will link your domain to PageSense. It does not need to be modified or updated to run different experiments. Think of it like installing a window into your website that only PageSense can use. The window doesn’t need to be reinstalled each time you want to open it, and changing the drapes won’t require a brand-new window.
If you don’t have access to your website’s code, or it’s built from a web hosting template service like Squarespace, WordPress, or Wix, you can find specific installation instructions for your web hosting service on Zoho PageSense’s snippet installation instruction page.
Synchronous vs Asynchronous Snippets
There are two types of snippet you can use: synchronous and asynchronous. The synchronous code will load each experiment on the page before loading the content of the page. This does affect load times, but a properly configured page should only experience a minor impact on page load times.
The asynchronous code loads your experiments in parallel with your website. This loads the page faster, but can produce “flicker” or movement on the page if the browser loads the A/B testing assets before the asynchronous code has fully configured the experiment.
Create a Space for Your Projects & Experiments
Zoho PageSense sorts your projects into Spaces. Space is a container for your projects. Projects hold experiments and their data. This includes things like A/B tests, split URL tests, heatmaps, form-filling analytics, and funnel analysis.
- Click on your profile picture in the upper right corner of the project or experiment listing page.
- Select My Spaces from the drop-down menu.
- Choose the + New Space option in the upper right corner.
- Give your space a name descriptive name of your choice.
- Click Create to create your new space.
Creating Projects Within a Space
To use projects effectively, you’ll want to keep similar experiments in the same project and use separate projects or even separate spaces for unrelated experiments. We recommend you create a new project for each domain.
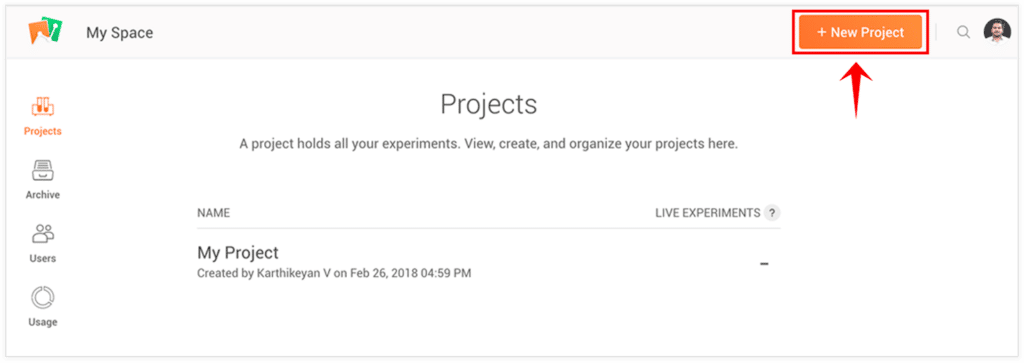
- Click Projects in the upper left corner of the experiment listing page.
- Click the + New Project button at the top of the page.
- Give your project descriptive a name of your choosing and write a brief description.
- Click Create to create the project.
Running Your First Experiment: A/B Testing
PageSense supports a variety of experiments that you can run, including A/B testing, split URL tests, heatmaps, form analytics, and funnel analysis. For our first experiment, we can create a simple A/B test. This will allow us to compare two versions of a web page against one another.
What is an A/B Test?
In an A/B test, a visitor will see either the “A” version or the “B” version of the page. While each visitor has an equal chance of seeing either version, PageSense ensures an even distribution among visitors. Basically, the system will show the A and B pages to approximately the same number of visitors, but there’s no way to know which page an individual viewer will see before they visit the website. With multiple pages, we can compare analytics to discover what helps and what hurts.
For a simple example of A/B testing, you might imagine testing different “call to action” copy, alternate page layouts, buttons compared to links, and much more. If you’ve ever wondered which feature would work better on your site, A/B testing let’s you definitely find out. It provides a way to back up your theories with customer data from your PageSense experiments.
1. Creating A New Test
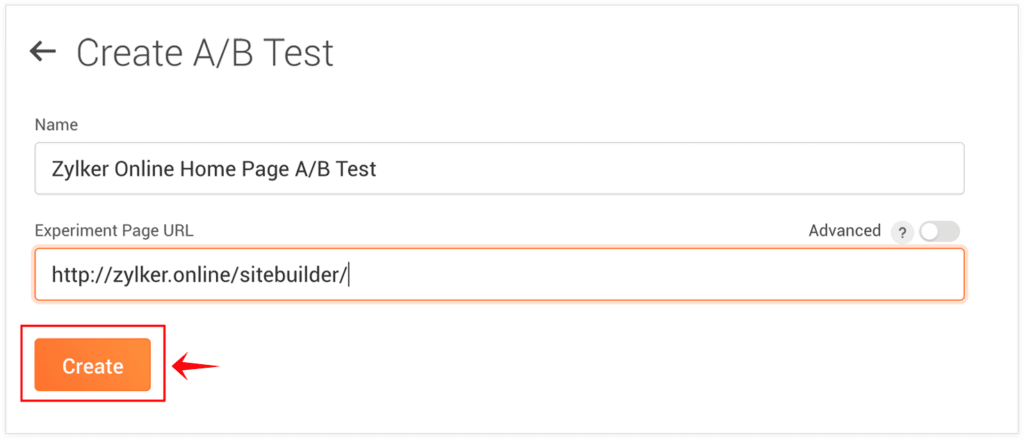
- On the left pane on the experiment listing page, click A/B Test.
- Click on New A/B Test.
- Paste the URL of the target web page for the A/B test into the Experiment Page URL field.
- Give the test a descriptive name in the Name field.
- Click Create.
2. Creating Page Variations with Editor
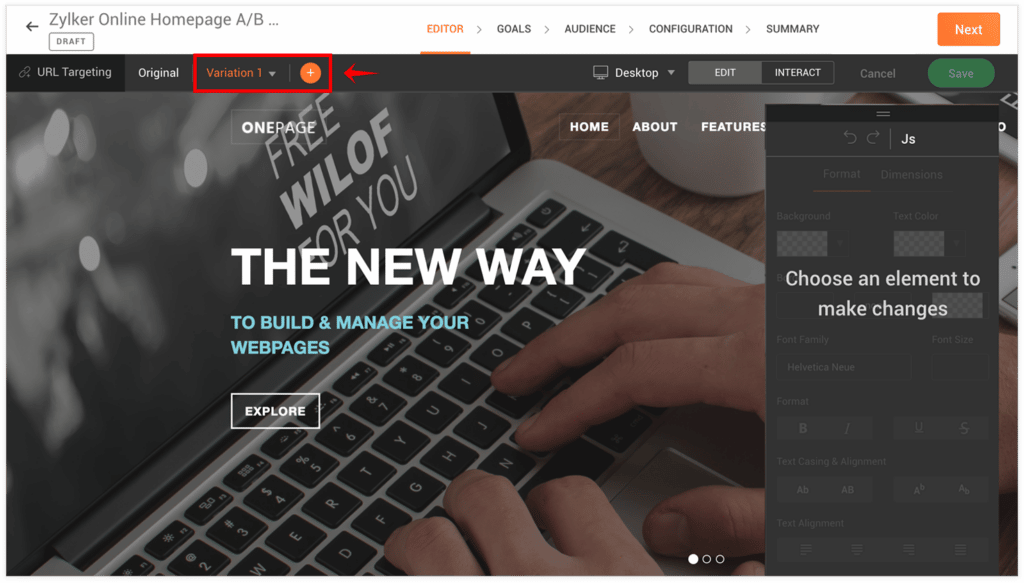
This will create the experiment that holds your A/B test, but you’ll need set up alternate pages in order for the test to be useful. The visual web page editor will open after you create your test. You can use its tools to create your variations for your A/B test. Here are a few tips for using the page editor effectively:
- Hover your mouse anywhere on the rendered web page to highlight a page element.
- Use the Format tab on the right to make the desired modifications to your candidate page.
- Click on individual page elements to reveal editing options for those page elements.
- To create additional variations, click the + icon.
- Use the toggle switch on the right to move between Edit and Interact modes, where you can test-drive your A/B tests in your browser.
Zoho provides a detailed explanation of the visual editor’s features. When you’re finished creating your variations, click Next to move on to the Goals tab.
3. Defining Data Collection Goals
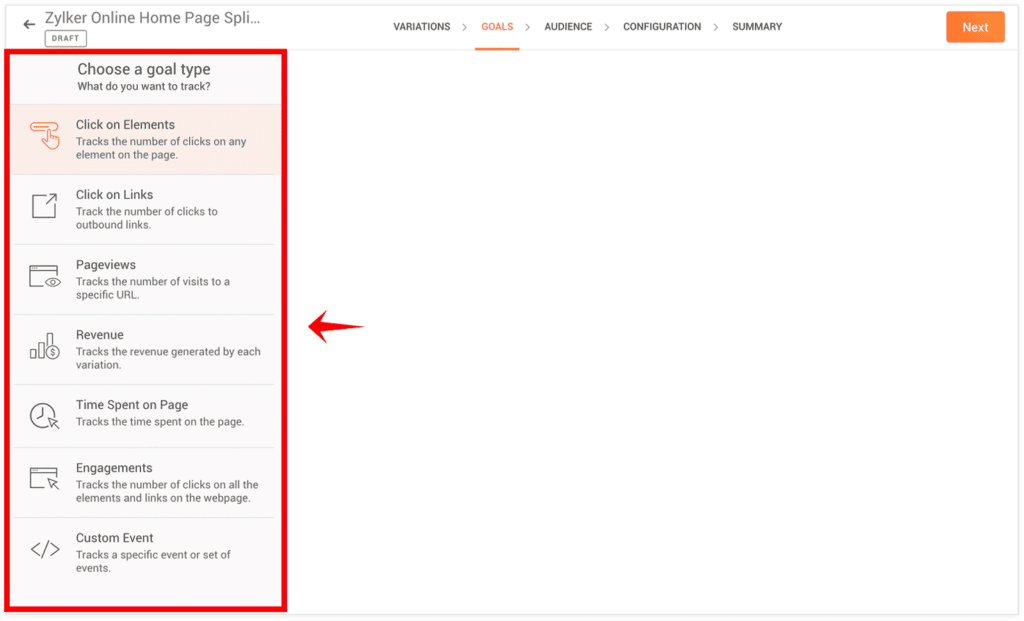
Goals are the individual actions you want to track across the A/B tests. For example, if you want to track how often visitors click on your sign-up button, you can use Click on Elements or Click on Link goal to track that.
- Click + New Goal to add a goal to your experiment.
- Set one of the following goal options to choose the specific attribute you’d like to track:
- Engagement: counts the clicks on all the elements and links on the experiment webpage and variations
- Pageviews: counts visits to a URL
- Clicks on Elements: count the clicks on a specific element on the experiment webpage
- Clicks on Links: count the clicks on outbound links
- Custom Event: count a specific event or set of events, as defined by your custom code.
- Revenue: Tracks the revenue generated by each variation, based on revenue numbers associated with each outcome.
- Once you’ve finished setting up your goal, click Save to commit your changes.
Once you’ve finished setting all your data goals, click Next to move to the Audience tab.
4. Setting Your Audience
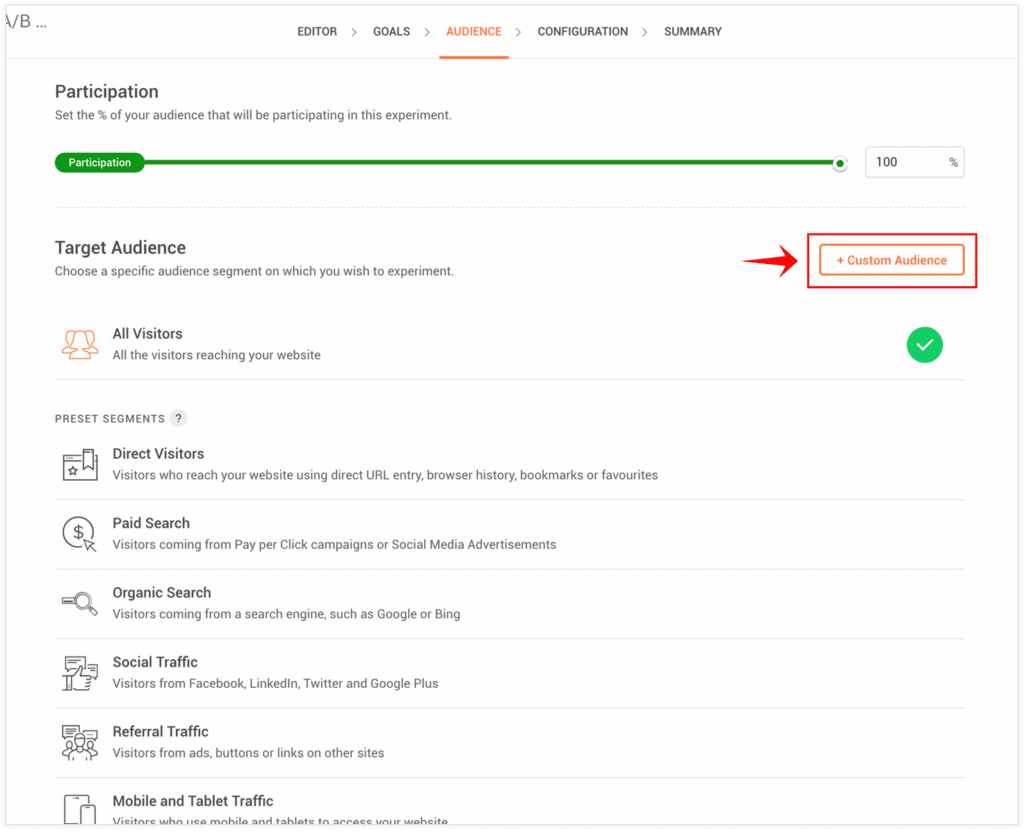
This setting defines what portion of your visitors will take part in the experiment. For our first experiment, we want to target everyone that comes to the experiment URL. On more complex experiments, we can use these audience segmentation tools to precisely target specific experiments.
- Under the Participation section, use the slider to set the percentage of your audience that will participate in the A/B test. Leave this at the default setting of 100%, unless you have a specific reason not to. This enrolls all your visitors in the experiment, providing the most meaningful data.
- Under the Target Audience section, you can target an audience segment based on behavior and origin. Unless you have a reason not to, you should leave this set to the default setting of All Visitors. This will capture the largest and most useful data set.
Once you’re done, click Next to move to the last settings page, Configuration.
5. Configuring Your Experiment
- Under the Segment Audience section, specify the traffic distribution across all the variants.
- Under the Set Mode section, choose the mode you wish to run your experiment. This will change how your data is analyzed by adjusting the target p-value of your data set. This will define the number of people tested in your experiment before the results are computed.
- Quick Trends: Quickly analyzes trends from a small data set. This is the least accurate but fastest option. This mode has a statistical significance of 90%.
- Optimal: If you don’t know what to choose, this is a good default option, balancing speed and accuracy. This mode has a statistical significance of 95%.
- High Accuracy: Use this mode for crucial experiments that can dramatically impact your revenue. Highly accurate, but requires a relatively large data set. This mode has a statistical significance of 99%.
- In the next section, you can turn on heatmap tracking. This will monitor all variations in the experiment and attempt to track how your visitors interact with the experiment web page. This runs alongside the existing A/B tests we’ve already configured. Heatmaps can make a great visual companion for the presentation of your experiment’s findings.
- In the Schedule section, you have the option to schedule a start time for your experiment. Check Launch this experiment later to schedule your experiment’s launch time for the future. To run the experiment immediately, leave this option unchecked.
Click Next to reach the final tab, Summary, where you can finally launch your experiment.
6. Launching Your A/B Test and Gathering Results
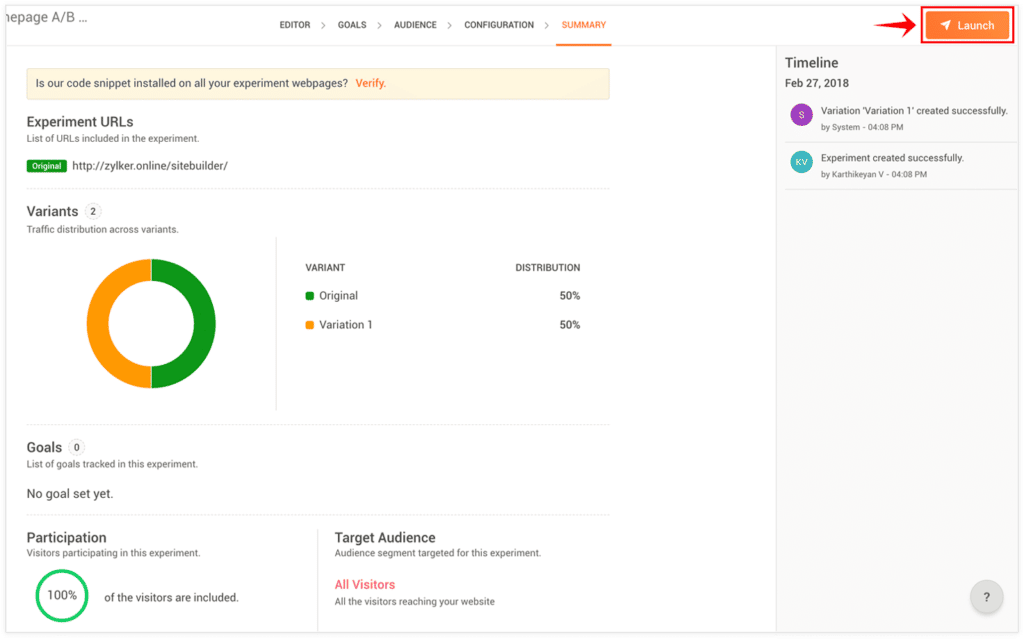
Look over all your details and make sure they’re correct. Once you’re happy with the details of your experiments, click the Launch button in the top right.
The Reports tab will open up alongside the Summary tab. This is where you’ll find your data as it is collected through the experiment. Even if you can see data as the experiment runs, remember not to make any judgments or decisions until the experiment is completed. With too small a sample size, you’re likely to end up with skewed or incorrect information, which is worse than no information at all.
When the experiment is completely finished, you can view the data in the Reports tab or export it in a convenient format for external analysis.


